GNFR is often a blind spot. Spend is spread across categories, locations, and suppliers, with limited visibility into what’s driving cost and consumption. We bring clarity through data insight and Power BI dashboards that help retailers understand what’s happening, spot opportunities, and improve performance across their GNFR operation.
Data & insight
Data & insight
Data insight that improves GNFR operations.
Data insight that improves GNFR operations.
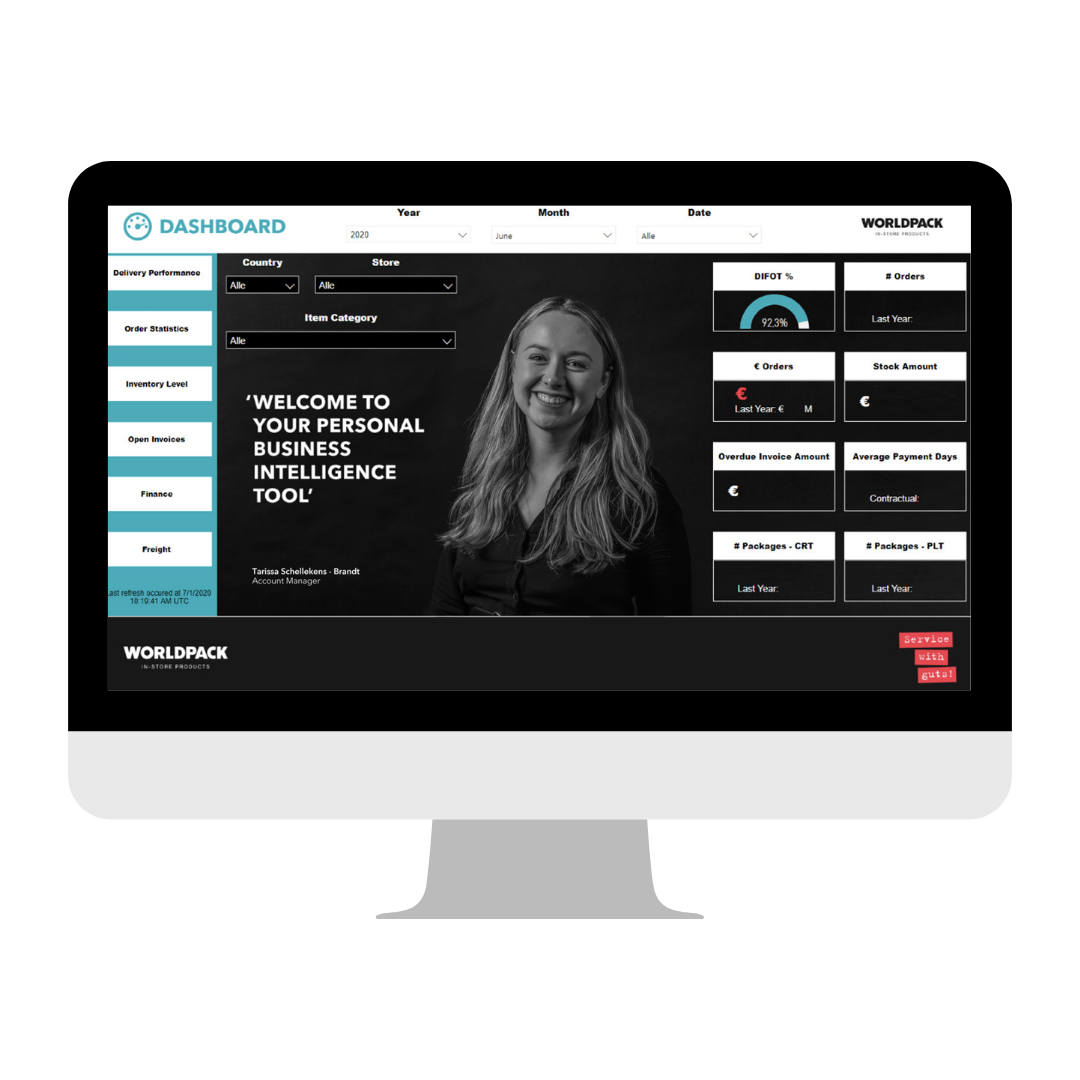
Make GNFR visible and manageable.
We provide clear Power BI dashboards that turn GNFR activity into insight you can actually use. You get visibility across spend, ordering patterns, product usage, and performance per store, category, or region. This helps teams move from reactive purchasing to proactive management.
Instead of relying on scattered spreadsheets or assumptions, you get one consistent view that supports better decisions at both operational and strategic level. The result is more control, fewer surprises, and a GNFR operation that becomes easier to steer.

Make performance measurable across every store.
Insight is only valuable if it leads to improvement. That’s why our dashboards are designed to help retailers act. You can identify outliers between stores, see where consumption is unusually high, and detect patterns that drive hidden costs.
- Clear overview of spend, usage, and ordering across locations
- Outlier detection and performance comparison between stores
- Better decision-making to reduce cost, waste, and unnecessary complexity